
How to analyze digital substation traffic efficiently and can we automate it?
In this paper we will review several Wireshark features which allow for more efficient network traffic capture analysis; we will find out where can we take network traffic capture files from and what are the basic requirements for these files; last but not least - we will see if we can automate capturing and analysis of digital substation traffic.
Three Wireshark features to increase efficiency in analysis of captured network traffic
Wireshark is one of the most popular instruments for capturing and analysis of network traffic in the market. It has plenty of features, allowing for easy yet detailed analysis of network data. We will share a few Wireshark features which will certainly increase your productivity at analysis of captured traffic.
Display filters in a toolbar
One of the well known and useful functions available in Wireshark is Display filter. Using this filter, user can command Wireshark to show only those frames which match the filter expression. When using Display filter, other capture data is hidden but not deleted from the capture by Wireshark, user can revert to original capture by clearing filter expression. For example, when performing analysis of network capture from digital substation, user can make Wireshark show only GOOSE messages, excluding Sampled Values traffic, or make Wireshark show only client-server communications (MMS). When defining Display filter expressions user can not only specify the protocol of the interest, but also protocol fields with certain values to show specific and indicative frames. For example, in relation to digital substation traffic, user can make Wireshark show all Sampled Values messages with SmpSynch field equal to Local; simulated GOOSE/Sampled Values message; GOOSE/Sampled Values messages, carrying data with quality attributes of certain value (invalid, test and etc.). One of the easiest and widespread ways to input and apply Display filter expression is to use Display filter text box, located just above Packet List pane.
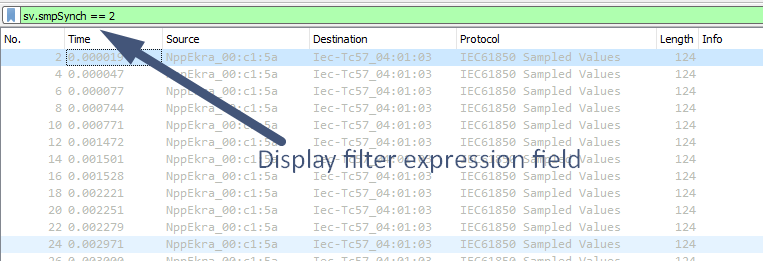 Display filter text box.
If you use some of the filters frequently, you can add filter buttons to the menu bar, so you will not need to enter them manually every time. To add a filter button, enter filter expression in Display filter text box and then click the plus (+) button on the right side of the bar. You will see a new bar below text box where you can specify label for a filter button and user comment, describing it; filter expression field will already be filled in with the filter expression, specified in text box.
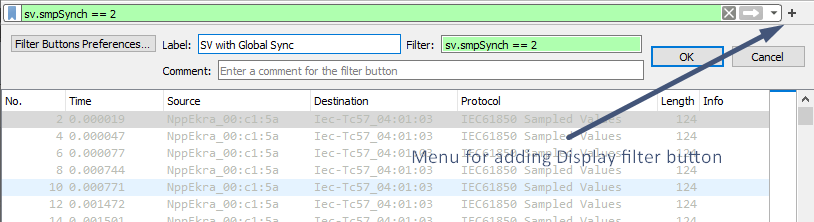 Adding filter button to the menu bar.
Clicking OK, you will see filter button in the menu bar. Clicking it, will apply the filter.
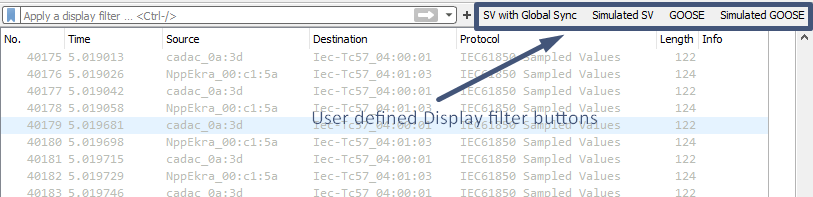 Examples of the Display filter buttons for digital substation engineer.
Fast input of the Display filter expressions is not only available through creation of the buttons. User can also click the ribbon button on the left side of the bar with specific Display filter expression filled in and choose Save this filter option. This will open a new window with all Display filters saved, including your newly added filter. You just need to assign a name to it by double clicking on it and hitting OK. Now you can click on ribbon and choose appropriate filter from the list. This is an alternative to buttons.
Using these features you will no more need to enter manually frequently used Display filter expressions. Create specific filters for GOOSE, Sampled Values, MMS and PTP messages as well as for other protocols, used in digital substations, indicating specific fields of these protocols and their values.
It is worth mentioning that having applied certain Display Filter, you can export only data which is displayed, omitting other captured traffic. This enables you to pass only relevant data to your colleagues, not passing them the whole network capture.
Marking and commenting frames
When user has found frames of the interest, they can be marked.
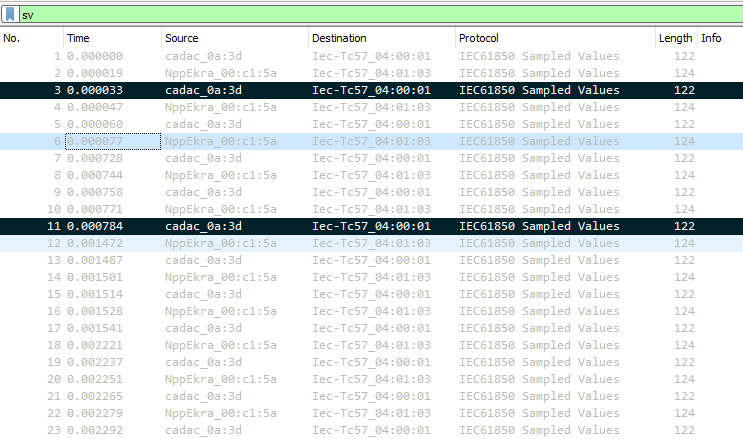 Marked frames have black background.
Marked frames can be easily identified amongst others, because they are shown with black background. One of the useful features with marked frames is that user can created a new network capture file based on the original, which includes only marked frames or all the frames from the first to the last marked (File - Export Specified Packets, then just choose the option which is relevant to you). It is quite useful when you did the investigations, found some specific frames and want to share the results with your colleagues, not sending them the whole capture.
To mark the frame, you need to click on it in a Packet list pane and press CTRL+M. If you want to mark several frames, choose several frames and use the same combination. To unmark the frame - do the same.
The only drawback of marking is that it is not stored in pcap (pcapng) files. This means that when you close the file and then re-open it, you will not see marked frames.
To indicate investigated things to your colleagues you can use packet commenting feature that is available in Wireshark. To leave the comment for your colleagues you need to right-click the specific frame in Packet List pane, choose Packet Comment option and enter the text of your note. Then you need to save the capture file as pcapng (which is a default option for Wireshark, starting from 1.8 version). When your colleagues open the file you provided them with, they can use 'frame.comment' Display filter expression for Wireshark to show all the frames with comments. Add this filter as a button or save it to the list available under a ribbon to view commented frames easily. The comment itself is displayed in Packet Details pane.
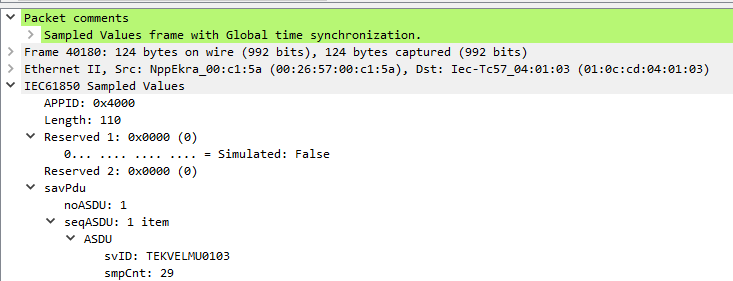 Viewing user comment in Wireshark.
Displaying user defined names of IEDs instead of their MAC and IP-addresses
Engineers who have practical experience of working with Wireshark must have noticed that Wireshark replaces first three octets of the MAC address (known as OUI – Organizationally Unique Identifier) of the IED network interface with the name of its manufacturer. This becomes possible as Wireshark stores data on relation of OUIs to manufacturers name (OUIs, in turn, are purchased by manufacturers from IEEE). But is it possible to make Wireshark use custom rules to replace specific MAC addresses to user-defined names? For example, to show instead of MAC-address 00:26:57:01:34:6e – Protection_IED and instead of 64:60:38:d0:34:6e – Eth.switch_SW22.
In addition to that it would be great if the user could define custom rules to replace IP-addresses on user-defined names of IEDs. For example, to show instead of IP-address 192.168.1.100 – SCADA and etc.
All this could ease the analysis of network traffic. And the answer is yes - this is possible.
For this, in Windows OS Wireshark version proceed to Help – About menu; in MAC OS version – proceed to Wireshark – About Wireshark menu. In a new dialog window choose Folders tab and then click the reference next to Person configuration option. In the folder that is opened create text file under name ethers. In this file specify MAC-addresses and user-defined names (separated by a space) of all IEDs, which traffic is expected to be in the capture file to be analyzed. New MAC-address and corresponding name must follow in a new line. Save changes.
                00.26.57.01.25.9f Protection_W1E
                00.26.57.01.25.9d Protection_W1E
                00.26.57.01.32.a7 Protection_W2E
                00.26.57.01.25.99 Protection_W2E
                00.26.57.01.38.2a SCU_W1E
                4a.00.62.06.45.a8 SCU_W2E
                64:60:38:d0:b8:18 Eth.switch_SW1
                64:60:38:d0:b7:18 Eth.switch_SW2
Identically edit or create text file under name hosts. In this file specify IP-addresses and user-defined names (separated by a space) of all IEDs, which traffic is expected to be in the capture file to be analyzed. New IP-address and corresponding name must follow in a new line. Save changes.
                192.168.1.210 Time_server_Main
                192.168.161.74 DFR
Fo Wireshark to use data from these files go to Preferences – Name resolution and make sure that Resolve MAC addresses and Resolve network (IP) addresses options are set. Restart Wireshark.
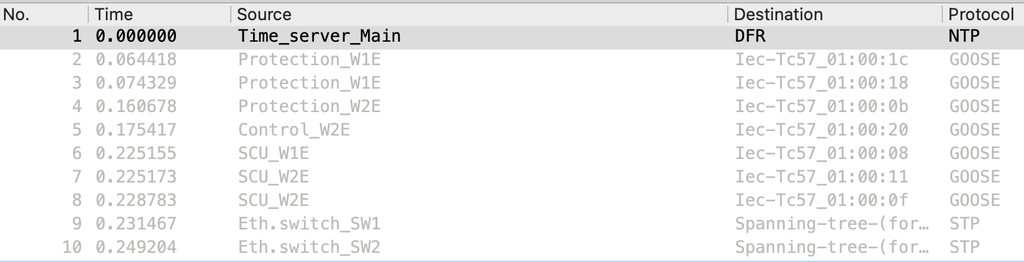 User-defined names for IEDs in Wireshark.
Export to CSV/JSON and other formats
Is it possible to analyze network traffic captures in a more familiar interface and maybe to automate it to some extent? Yes, it is. For example, in Microsoft Excel or automate the analysis in Python.
For making this possible Wireshark provides export feature to a range of data formats - CSV, JSON, plain text, XML and etc.
CSV can be one of the most common formats as it can be opened in Microsoft Excel, for example. Using Excel built-in features, user can quickly search for certain frames and even create graphs, visualizing current, voltage and binary signals, transmitted with GOOSE, Sampled Values and MMS messages.
To export data, user needs to expand the frame, select the field of the interest (for example, current/voltage data in Sampled Values message), right-click on it and choose Apply as a column option. Then you will see the chosen fields available in Packet list pane. To export the data, choose File - Export Packet Dissections, choose the required format (for example, CSV) and frames to be included in the exported data (all captured, displayed, marked and etc.).
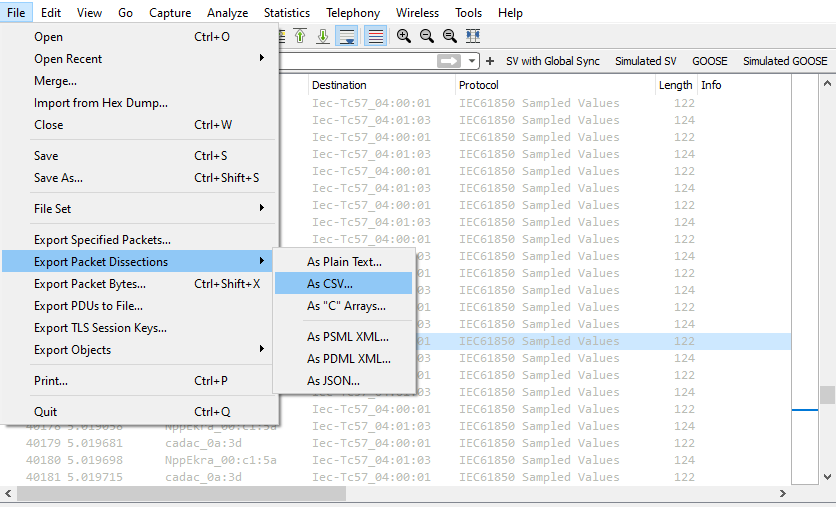 Export of the captured network traffic to CSV/JSON/Plain text and etc.
Then you can apply your Microsoft Excel skills to perform the analysis. Those who are familiar with Python can automate the processing, analysis and the visualization of the data - the only limit will be your skills and knowledge (for example, using JSON data).
Using this feature, you are not eliminating manual labor, but you can reduce the amount of it to some extent.
Where do I get network traffic capture files from and what are the requirements?
Of course, you can use PC and Wireshark to capture traffic. But you will not be able to use single PC in digital substation to capture all the traffic. First, there's too much data (we will be covering this in a few lines below) and PC will reach its operational limits quite fast and will not be working stable; second - to capture all the data you need to connect to different network segments (for example, station and process bus), but how are you going to synchronize and align data? Using PC and even servers without dedicated software and time synchronization support this become not a trivial task.
One can also meet or be a customer, who is pursuing the capturing all the traffic continuously and storing it for 3 and even 6 months. What should be your network storage to handle that? It is not hard to perform such calculations. For example, for a small 110 kV substation with 22 Sampled Values streams and 120 GOOSE-messages, you will need 100 Tb/month. To store the captured data for 6 months, you will need 600 Tb. That's a lot. The cost of that requirement is going to be quite high, equal to the cost of several protection and control panels (if not to the cost of all protection and control panels as you will not only need the network storage, but also capturing devices and dedicated software).
What are the alternatives? Well, we can perform network traffic capturing and recording with the same approach as fault recorders record currents, voltages, frequency and binary signals - we can trigger recording of the traffic based on communication events (loss of the message, time synchronization quality change and etc.), data change in messages and other criteria. The recorded data could include pre- and post-event traffic captures; it could also be a single network traffic capture file, with data from several digital substation LAN segments aligned based on time synchronization of the capturing devices. With this approach we can store and process PCAP files over several years.
The described functionality is delivered with Tekvel Park digital substation lifecycle management system. Tekvel Park has modular structure, including a server and network monitoring devices (which we call Live View Boxes).
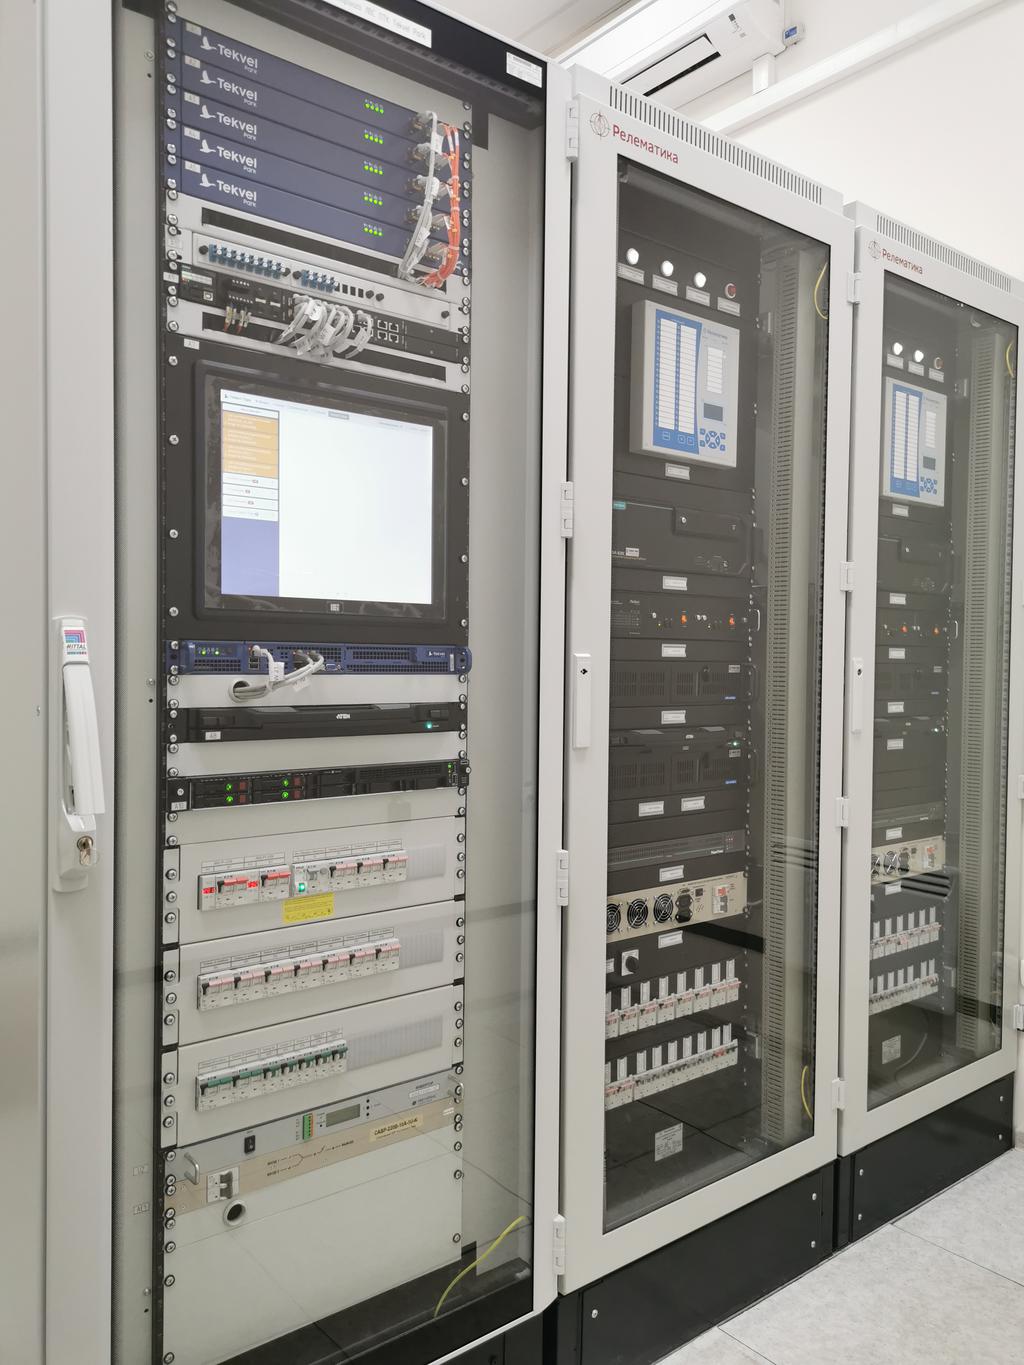 Tekvel Park in one of digital substations with process bus (leftmost panel).
Tekvel Park can be easily scaled to capture all the network traffic in digital substation. This is provided by the required number of Live View Boxes, which provide not only capturing but also the processing of the captured data. The captured data is then transferred to the Tekvel Park server which allows for the application of servers with less performance and less number of communication interfaces and, as a consequence, to cheaper servers for performing the task.
 Tekvel Park - Live View Box.
User can download network capture PCAP file from Tekvel Park for each identified event. And then user can perform the analysis, using Wireshark features, described in this paper.
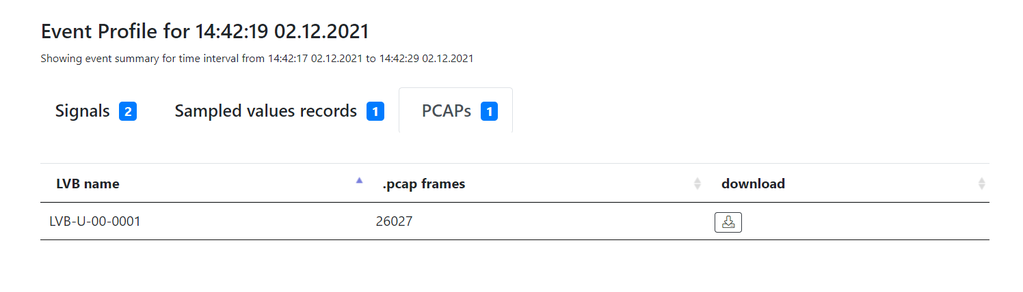 Event profile in Tekvel Park interface with the ability to download recorded network traffic capture as PCAP file.
Is it possible to automate the analysis of digital substation traffic and make it online?
Yes. This is why we created Tekvel Park. Compared to Wireshark, it has a number of outstanding functions:
- Online and automatic monitoring of IEC 61850 traffic against SCD file. User gets the detailed information about the parameters of the messages, which are not matching the configuration as per SCD file, in Tekvel Park events log.
- Online and automatic detection of IEC 61850 communication failures (message counters failures, time sync status changes, loss of messages and etc.). All the failures are stored in events log with timestamp; name of the IED, the failure is associated with; control block name of the messages and short description of the failure.
- Online and automatic detection of data changes in GOOSE/Sampled Values messages.
- Traffic recording, initiated by the events, identified by Tekvel Park, with the capturing of pre- and post-event traffic. Provided as a single PCAP file in Tekvel Park event profile.
- Visualization of waveforms based on GOOSE and Sampled Values data with signals description in your native language.
 Tekvel Park events log.
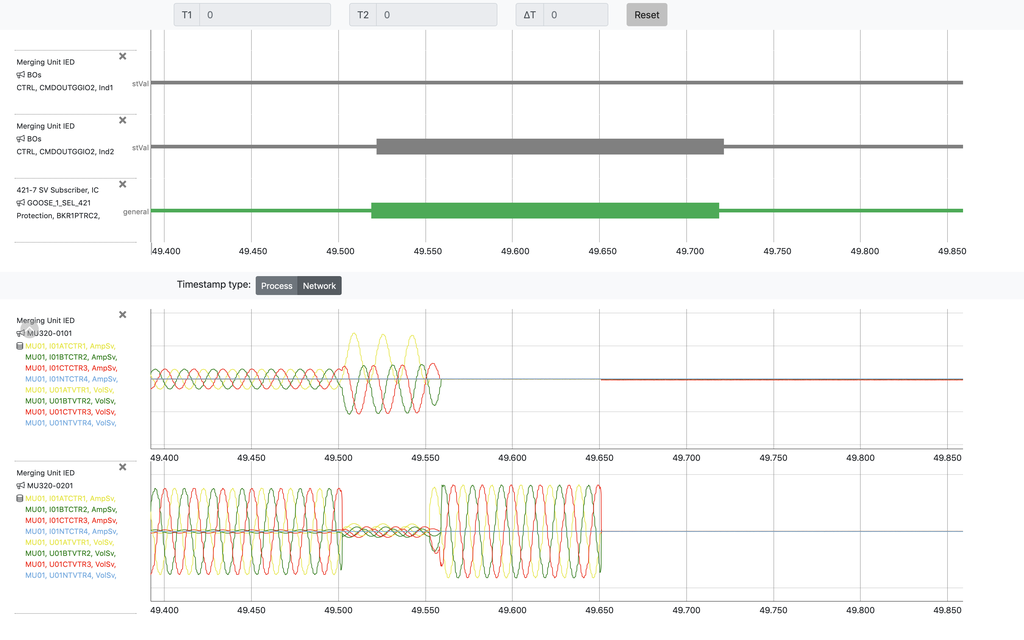 Visualization of waveforms, based on GOOSE and Sampled Values data.
It turns out that in most cases you do not even need to download PCAP file from Tekvel Park and analyze it manually. This analysis is done automatically and in online mode. It can be a rare situation you need to verify some data and resolve some tricky situation and Tekvel Park will not let you down in this case, providing with accurate PCAP file.
Do not get lost in digital substation networks!
last articles


Verification of SCD files for digital substations: requirements and practical experience
18 November 2021