
Tekvel Park Quick Start Guide
We have introduced a number of new features to Tekvel Park recently, and we want you to try them and figure out the benefits of IEC 61850 communications empowered by Tekvel Park analysis and monitoring.
So here are the 7 steps to your fully monitored digital substation.
Step 1. Create your secure account
Go to https://park.tekvel.com and verify that your browser shows Secure connection status. This ensures that you are communicating to our servers, not third party's.
Verify Secure connection status with https://park.tekvel.com
Click Sign up button and type your personal information. Note that we never share this information with any third parties and we take best efforts to store it securely.
Fill your data
Check your email inbox, it shall contain the message from Tekvel Park. Please, ensure that it doesn't get to Spam folder.
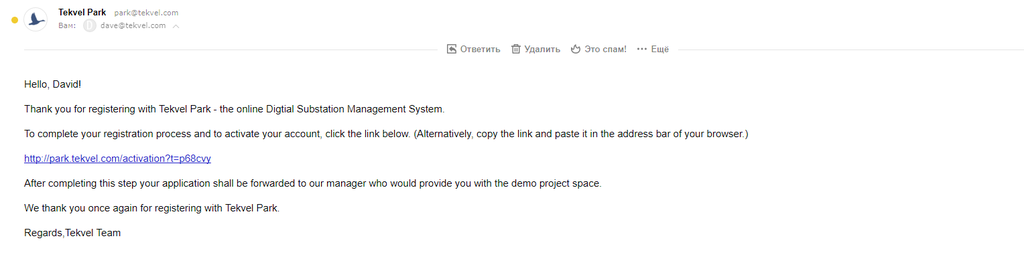
Activation Email
Once you click the link in the email, your account shall be activated and you would be able to login to Tekvel Park.
Login to Tekvel Park
At this point you are all set and ready to use Tekvel Park.
There are two options for you to continue:
- Wait for our managers to contact you and provide you with a demo "coin" to create a new project. Our manager will automatically get a notification once you have activated your account, so you won't have to wait long and you don't need to make any additional requests.
- Ask you colleagues already having a project in Tekvel Park to provide you with an access to their project. Each project owner in Tekvel Park can add unlimited number of users to their projects.
Step 2. Create a new project and upload SCD
We'll suppose that you have received our demo "coin" from our managers or purchased a licence for Tekvel Park. So you would need to create a project from scratch.
When our manager gives you a demo "coin", you'll be notified by an email like the one below.
Coins added to your account
Now once you login to your account, you'll see an empty dashboard with one rounded square with "+" (plus) sign inside. Simply click this square to add new project. Give a name to the project that will be used for further display purposes. You can change a name any time later.
Create a project
Finally you would find yourself at the main project dashboard. Where you can directly upload an SCD file to the system.
By the way, there is one more option: you can simply add another user to the project and ask him to upload a file. But we shall cover this option later.
Easy as one-two-three-four:
- Click Upload button
- Click Browse and select a file to upload
- Write a comment (this is optional, but you'll find it very convenient later)
- Click Send
- Be patient, please. It will take Tekvel Park some time to process your file. This might take even several minutes for big projects.
SCD file upload
That's it. Now you can open your project and start working with it.
Step 3. Visualize GOOSE and SV communications
There is nothing special you need to do here. Simply open your project, then click Main button, and here it comes -- the Wheel.
We have already described what you will see there previously, so here is just a GIF :)
Explore the GOOSE (and SV) Wheel
Step 4. Analyze your configuration
Tekvel Park always takes the best effort to visualize your communications, even if there are errors in the configuration or syntax is invalid. But we never loose these errors. We just carefully collect them in Analysis tab under Main view. If you want to share this analysis with someone, simply click Export button to create PDF, XLS or CSV document.
Analyse our configuration and export results to share with colleagues
Step 5. Set up a Live View
We'll give just a brief overview of the system architecture here to make it absolutely clear for you. Tekvel Park system consists of 3 major parts:
- Tekvel Park Server (or TPS) (the one you are communicating at https://park.tekvel.com)
- Client (this is you, or, to be precise, your web-browser)
- and the Live View Box (or LVB) that we haven't yet introduced so far.
What is LVB?
LVB is an important part of Tekvel Park system used to provide the information of what is going on in the network to Tekvel Park Server. So basically LVB communicates both to the substation network and Tekvel Park Server.
There are 3 important facts you need to know:
- LVB does not collect and send to the server all data from the network. It only receives GOOSE and SV messages (i.e. multicast), processes them and, if necessary, sends processed data to the server.
- LVB does not expose any data to the substation network. Neither GOOSE, nor SV. Nothing.
- LVB requires connection to Tekvel Park server, so while using our cloud TPS (at https://park.tekvel.com) LVB would need to be connected to the Internet. Otherwise TPS can be located in Intranet, so no outbound Internet connection will be required.
Generally speaking LVB is a hardware module specifically designed for substation use. And in that case, the reference architecture of Tekvel Park system would look like the following.
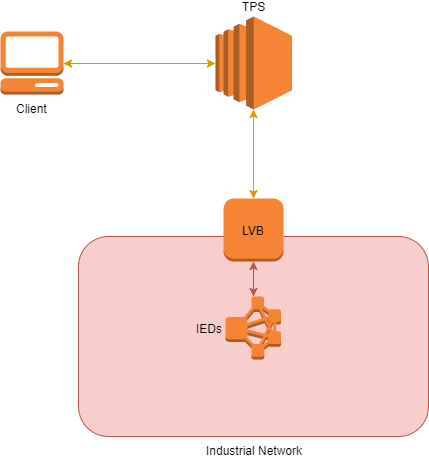
Tekvel Park System Reference Architecture
But hardware is way too complicated for simple demonstration. So we have simplified this by making a special LVB application for your Windows PC (we can also provide Linux binaries upon request). By running this on your laptop, you would be able to use almost all capabilities of Tekvel Park in demo mode with no additional hardware. The simplified architecture is shown below.
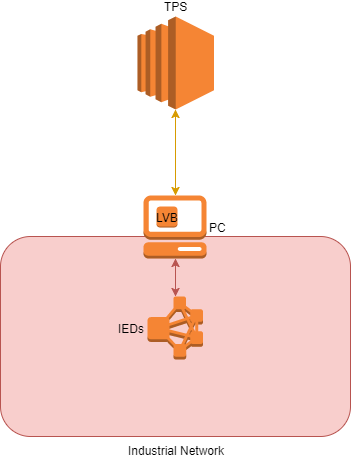
Simplified Architecture for Tekvel Park demonstration
So in the context of this guidelines, we'll refer to LVB as an application, running locally on your laptop and providing data to TPS.
This, in turn, requires you PC to be simultaneously connected both to substation (industrial) network and Internet.
One of possible options would look the following way:
- Your laptop shall be connected to the substation network via Ethernet interface
- and connected to corporate network with Internet access via WiFi interface.
Another option is to use a mobile phone as an access point to Internet. Please, consult your cyber-security staff not to have trouble with that.
Download LVB
LVB can simply be downloaded from Project menu.
Download LVB
The LVB ZIP-archive contains 6 files:
- LVB application itself,
- XML configuration file (generated automatically by the server)
- Four .bat files that can be used as shortcuts to run LVB in different modes.
Extract these files to a local folder on your PC. And run LVB_Regular_Run.bat.
The .bat file can not be signed, so the system would prompt the Unknown Publisher message. Please, confirm that you want to run this application.
When running LVB for the first time, you would need to select the Network Adapter to be used to capture network traffic (i.e. the one, connected to the substation network).
Simply type the number of the adapter as shown in the list and hit Enter.
Running LVB Application
What if our system policy won't allow me to run unsigned application?
No problem -- simply run lvb_app.exe itself. The binary file is signed with our Code Signing Certificate issued by one of the major Online Certification Authorities, so it must work for you. The only limitation in this case, is that it would only work in regular mode, i.e. GOOSE-only.
Running Signed LVB Application
So our LVB is running. Note, by the way, the message [Connected] appeared in the command line window, stating that LVB has connected to the TPS.
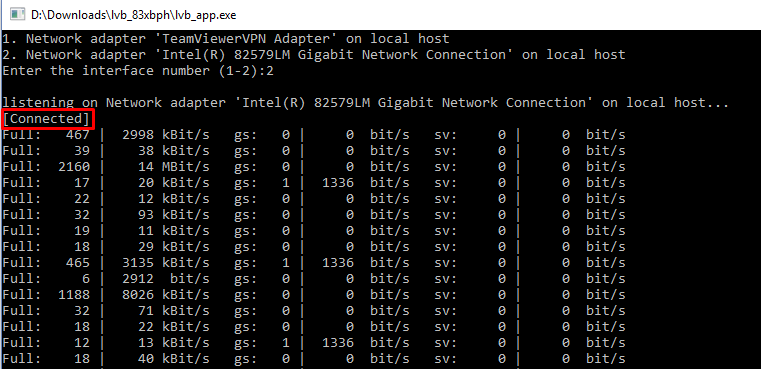
LVB is connected to the Server
Now let's verify the system is working. Simply go to Main menu and click Live button.
Enabling Live View
Step 6. Exploring the Live View
The Live View is not that much different from the regular view. There are two major differences between Regular and Live View:
- All elements, i.e. IEDs, GOOSE and SV control blocks, datasets and down to data attributes are colored in the Live View.
- There can be GHOSTS...

The Ghost
Well... not that kind of Ghosts ^_^
Color
To make a long story short, we won't discuss all possible options here, leaving it for the detailed manual.
There is one simple rule for colors in Live View: Everything MUST BE GREEN.
Ghosts
What is Ghost? A Ghost is just a message (GOOSE or SV message) that is not supposed to be on the network, i.e. there is no GOOSE/SV control block configured to publish that kind of message in the SCD-file.
There is one simple rule for Ghosts as well: There shall be NO GHOSTS on the network.
So, keeping in mind these two rules (ALL-GREEN, NO-GHOSTS), we can see that the below example is absolutely disgusting: all IEDs are blinking red (which means they publish nothing) and there is a Ghost GOOSE-message.
Explore Live View
So, making our system better, let's first get rid of Ghosts by disconnecting IEDs or changing their configuration.
Ghost goes offline
The above example shows Ghost GOOSE disappear as well as the notification appearing on the top of the screen. So the system became better: there is no Ghost GOOSE messages anymore... but no designed GOOSE-messages either. Let's add them by connecting correctly configured IEDs to the network.
IEDs go online one-by-one
So now the system is fully online. Simply mouse-click the orange messages to make them disappear.
NO-GHOSTS & ALL-GREEN => WE ARE FINE
Step 7. Analyse Event
There is one last thing you would definitely need to analyse your system performance. Let's assume you have some event happened with your system, leading to a change of data in some GOOSE message.
In this case you would be promptly notified by Tekvel Park with a pop-up message. Click the eye-icon in the message to open Events Log.
The Events Log contains ALL events that have been happening to the system since the project has been created. The events are classified into several groups, like Communication Issues, Process Events, etc.
Simply click the event timestamp and if there are records available for the timestamp selected, you would see the Timelines for the signals, that have been changing close to that time.
From online monitoring to fault record analysis
That's it for now. Sign-up and play around!


